
Calculate industrial labeling machine capacity from accepted containers per production period, then account for the losses included in that period. Convert bottles per hour and bottles per minute consistently, and separate container rate from label-dispensing rate. The result should be a package-specific operating requirement that a supplier can test, rather than an unexplained maximum-speed target.
Capacity mistakes often begin with correct numbers used in the wrong context. A filler may be rated in bottles per hour, a label head in meters per minute, and a packing machine in packs per minute. Those figures describe different parts of the production process and need a common basis before comparison.
Which Output Number Should You Start With?
Start with the number of acceptable labeled packages that must leave the station during a defined window. Specify whether that window includes scheduled breaks, cleaning, changeovers, and material replenishment. Keep a written boundary for the calculation so every supplier uses the same assumptions.
If the plan calls for 48,000 accepted bottles in an eight-hour shift, dividing by 480 gives 100 accepted bottles per minute across the whole shift. If only 400 minutes are allocated to production after scheduled activities, the required average during those minutes is 120. These are planning examples, not equipment ratings.
Use demand by format rather than one average across the entire product range. A large bottle with a long wrap may run differently from a small bottle with a short panel label. The machine must meet the schedule for each required format, not just for the easiest demonstration bottle.
How Do You Convert Between Common Capacity Units?
Divide bottles per hour by 60 to obtain bottles per minute. Multiply packs per minute by bottles per pack to estimate the equivalent container rate, provided the packer is continuously operating in that format. State whether the quoted figure is nominal, demonstrated, or accepted output.
| Illustrative Input | Conversion | Comparable Rate |
| 12,000 bottles per hour | 12,000 divided by 60 | 200 bottles per minute |
| 20 packs per minute, six bottles per pack | 20 multiplied by six | 120 bottles per minute |
| 120 bottles per minute, two labels per bottle | 120 multiplied by two | 240 total label applications per minute |
Two labels per bottle do not always mean that one head must dispense twice as fast. A machine with separate front and back heads may divide the applications between those heads. Confirm the actual arrangement before converting an application rate into a bottle rate.
For wider line planning, review the sequence in the complete water bottling process. Each stage needs a compatible throughput assumption. Document the limiting stage for every major SKU.
How Do You Allow for Operating Losses?
Use measured loss assumptions where possible and label estimates clearly where data is missing. For a defined production window, accepted output depends on operating time, actual running rate, and the share of output that meets the acceptance criteria. These factors should be recorded separately so the forecast can be corrected later.
An illustrative calculation is: required nominal rate equals accepted demand divided by planned minutes, availability, performance factor, and quality yield. For 48,000 accepted bottles, 400 planned minutes, 0.90 availability, 0.95 performance, and 0.99 yield, the calculated rate is about 142 bottles per minute. This example establishes a mathematical requirement under stated assumptions; it does not select a particular model.
Use that result cautiously if the loss factors are guesses. A small change in changeover time or restart rejects may materially change the answer. Evaluate a conservative case before making a purchase that depends on optimistic performance.
Why Can Label Length Limit the Speed?
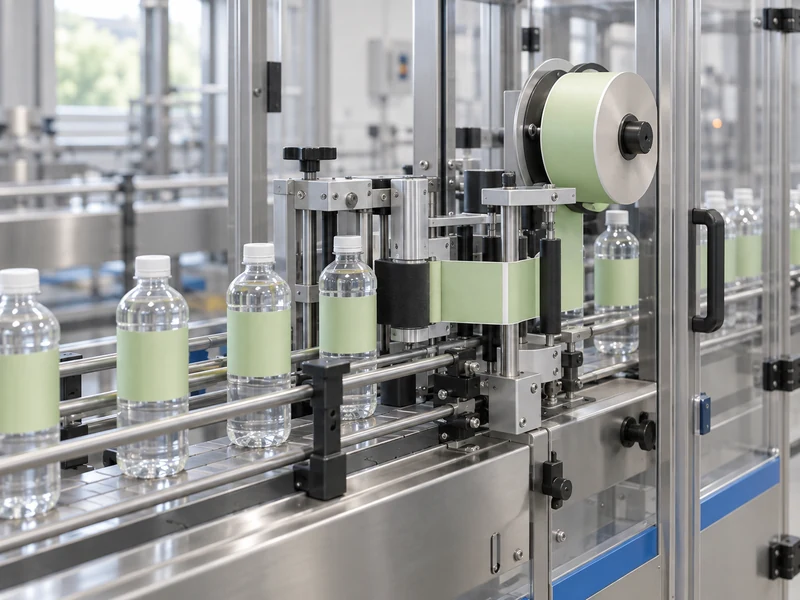
A label head must advance enough web for each label and its gap. Longer labels require more web travel per application, which can make the dispensing system a constraint even when the conveyor could run faster. The machine supplier should assess the complete feed-and-apply cycle.
For illustration, a 200 mm label plus a 3 mm gap requires 0.203 meters of web per label. At 150 single-label applications per minute, average web consumption is 30.45 meters per minute. Instantaneous dispensing behavior and control limits still need supplier confirmation; average consumption alone does not prove feasibility.
This is why a short-label speed demonstration cannot automatically qualify a long wrap. Send the longest relevant label and the intended roll construction during the quotation stage. Ask for the tested speed on that exact combination.
How Much Capacity Margin Is Sensible?
Choose margin from identified risks rather than applying a universal percentage. Consider demand growth, material variation, replenishment interruptions, and the need to recover after short stops. Excess capacity is valuable only when the surrounding line and production plan can use it.
Review the proposed station within the BRENU industrial labeling range, then request a package-specific operating window. A range shown on a category page may cover different configurations. It should not replace a written commitment for your application.
Ask for the minimum stable operating rate as well as the upper limit. A machine that meets peak demand must also run cleanly during reduced feed or startup. Quality throughout the agreed operating window matters more than a single impressive peak figure.
What Can Accumulation Do for the Line?
Accumulation can absorb a limited interruption or temporary rate difference when the containers tolerate the handling method. It cannot eliminate a persistent capacity shortage. If the packer is slower than the labeler throughout the shift, the buffer will eventually fill.
At 180 bottles per minute, a one-minute interruption represents 180 incoming bottles. That is a first estimate of required usable capacity if upstream production continues at the same rate. Real design must account for existing buffer occupancy, product stability, control response, and physical conveyor behavior.
When connecting to a monoblock filler and capper, identify how each station responds to blocked discharge or missing product. Define who controls the conveyors between machines. A line-speed calculation is incomplete without those operating states.
How Does Packing Affect the Labeler Requirement?
Packing creates a different grouping rhythm from individual-container labeling. A change from six-bottle packs to twelve-bottle packs can alter the packer’s container-equivalent rate even when its cycle rate looks unchanged. Format changeovers may also occur at different times across the line.
Use the comparison of shrink wrapping and carton packing to frame the downstream format discussion. Confirm accepted containers per minute for the chosen pack configuration. Include the handling required to protect freshly applied labels.
For cold-filled products, the carbonated drink line process also helps identify intervening operations. Any conditioning or transfer step between capping and labeling needs its own capacity check. A labeler should not be sized as if it receives perfectly spaced, dry containers unless the line actually provides them.
What Should a Capacity Test Record?
Record accepted output over a stated duration, together with running time, stoppages, rejects, and interventions. Include the material and format identifiers. A counter reading without quality inspection can overstate useful output.
Recommended records include:
- Start and finish time, scheduled time, and actual running time.
- Total containers processed and accepted containers released.
- Reject quantity and agreed reason categories.
- Roll changes, jams, adjustments, and restart events.
- Label position checks at selected points during the run.
- Upstream starvation and downstream blockage separately from labeler faults.
Keep the test rate and acceptance rate connected. If speed is increased but inspection is skipped, the result does not answer the purchasing question. Repeat the necessary quality checks at the agreed upper and lower operating rates.
GS1’s barcode verification process guidance is relevant when readable, correctly encoded barcodes form part of package acceptance. Include the required evidence in the test plan. Counting a container as labeled should not automatically mean it is acceptable.
How Should You Handle Several Products on One Line?
Calculate the required production time by format before combining the schedule. Different bottles and label arrangements may have different demonstrated rates, and a weighted average rate can hide a difficult low-volume SKU. Add the relevant transitions and planned tasks after calculating each format’s production time.
For illustration, 12,000 bottles at an accepted rate of 100 per minute require 120 minutes, while another 12,000 at 80 per minute require 150 minutes. Together they need 270 production minutes before any separately excluded setup allowance. Using 100 per minute for both would understate the requirement by 30 minutes.
Keep the rate basis consistent: if those accepted rates already include typical short stops, do not apply the same stop allowance again. Review the resulting schedule against the actual shift window. This format-by-format method shows whether the constraint is the main product, a demanding secondary package, or the number of transitions.
How Should You Present the Final Capacity Requirement?
Present one line per SKU with demand, production minutes, label count, label dimensions, assumed losses, and required tested output. Add the planned operating range and interface conditions. This makes disagreements visible before a machine is built or shipped.
Ask BRENU to confirm the offered configuration against that matrix and identify any limiting formats. If a target requires different tooling, a different label design, or a lower rate, resolve it while the project is still adjustable. A defensible capacity plan is a reproducible calculation supported by a representative test.