
Total water demand for a bottling plant includes water that becomes bottled product, plus water used for rinsing, cleaning, treatment losses, and supporting utilities during production.
Calculate each stream over the same operating period, then convert the balance into source-water intake and check peak flow and storage separately for the selected line.
Define the Water-Balance Boundary
Before calculating water demand, define where the water balance starts and ends. A clear boundary prevents the same water from being counted at multiple stages of treatment or production.
For most bottling plants, the calculation starts at the raw-water intake and follows water through treatment, purified-water storage, filling, rinsing, cleaning, and other uses.
Every stream should have a defined source, destination, and measurement period. The categories below identify streams to investigate; overlapping categories must not be added as separate totals.
- Filled water: Water delivered into filled bottles, including overfill and water in filled bottles that are rejected.
- Non-product process water: Water consumed by bottle rinsing, CIP makeup, backwashing, and other production activities.
- Treatment losses: Water discharged as RO concentrate, pretreatment backwash, or other treatment waste. Backwash appears once in the balance, even if also listed under process uses.
- Utility water: Fresh makeup water required by cooling systems or other supporting equipment.
- Recovered water: Water reused in an approved process that genuinely reduces fresh-water demand.
Keep three measurement points separate: raw-water intake, treated-water production, and water delivered to each end use. Water passing between these points is an internal transfer, not an additional source-water requirement.
For a worked example, assume that product filling, bottle rinsing, CIP makeup, and utility makeup all use RO permeate. Pretreatment backwash draws directly from the raw-water supply before the RO system.
This is an illustrative configuration, not a specification for every bottling plant. Actual supply arrangements depend on source-water quality, finished-product requirements, and the selected treatment process.
Calculate Finished Product Water Demand
Finished product water establishes the volume that the bottling line must deliver. However, the target number of good bottles is not necessarily equal to the total number of bottles filled.
A plant may fill additional bottles to account for quality rejects, while actual fill volumes may exceed nominal package volumes. Calculate these factors separately before establishing total filler consumption.
Define Good Bottles, Gross Bottles, and Overfill
Use the following definitions:
- Good bottle target: The number of acceptable, saleable bottles required per day.
- Gross bottles filled: All bottles receiving liquid, including filled bottles subsequently rejected.
- Overfill: The additional liquid above the nominal package volume.
- Filled rejects: Bottles that receive liquid but are rejected and not recovered into usable product.
The gross number of bottles filled equals the good bottle target plus filled rejects, provided both counts refer to the same production period.
Unfilled or empty rejected containers do not contribute to filling-water demand. Filled rejects do contribute because water has already entered those containers. Reuse requires a validated, approved recovery process.
Calculate the Daily Filling Volume
The nominal product requirement is:
Nominal Product Water = Good Bottle Target × Nominal Fill Volume
The total volume delivered into bottles can then be calculated as:
Total Filled Volume = Nominal Product Water + Good-Bottle Overfill + Liquid in Filled Rejects
Consider the following illustrative assumptions for a plant producing 500 mL bottles:
- Good bottle target: 20,000 bottles per day.
- Filled rejects: 400 bottles per day.
- Nominal fill volume: 0.500 L per bottle.
- Actual average fill volume: 0.505 L per bottle.
The resulting water balance is shown below.
| Filling component | Calculation | Daily volume |
| Nominal product water | 20,000 × 0.500 L | 10,000 L |
| Overfill in good bottles | 20,000 × 0.005 L | 100 L |
| Water in filled rejects | 400 × 0.505 L | 202 L |
| Total volume filled | 10,000 + 100 + 202 | 10,302 L |
All values in this example are illustrative assumptions, not Brenu equipment specifications.
The example distinguishes the 10,000 L nominal product target from the 10,302 L actually filled. The additional 302 L consists of good-bottle overfill and liquid in filled rejects.
Use actual filling consumption rather than nominal product volume alone. Record spills, startup flushing, and other measured losses as separate items only when they are not already captured by the consumption meter.
If rejected liquid is recovered through an approved process, credit only the verified recovered volume that offsets fresh demand. Do not assume rejected bottled water can automatically return to production.
Add Non-Product Process Water Demand
Filling is only one part of a bottling plant’s water consumption. Rinsing, cleaning, treatment maintenance, and utilities create additional demand, depending on the equipment configuration and operating schedule.
Calculate each use from its actual operating parameters rather than applying one universal allowance. Record fresh-water consumption separately from recirculating flow so that internal circulation does not inflate daily demand.
Calculate Bottle Rinsing Water
Bottle-rinsing demand depends on container type, rinsing method, water consumption per container, and the total number of containers processed.
For single-use PET bottles, the line may use air rinsing or water rinsing, depending on the selected configuration and product requirements.
Returnable containers require a separate calculation because washing and rinsing may involve multiple stages. Include solution preparation, fresh makeup, final rinses and scheduled tank changes for the installed washer.
Use the following formula when water consumption per container is known:
Daily Rinsing Demand = Gross Containers Processed × Fresh Water Used per Container
For the illustrative example, assume the plant water-rinses all 20,400 gross containers and uses an average of 0.15 L per container.
Daily rinsing demand is therefore 20,400 × 0.15 L, or 3,060 L/day.
This assumption is for calculation purposes only. Actual consumption must be established from the selected rinsing equipment, operating settings, and container-handling requirements. Include rinsed bottles rejected before filling where applicable.
Calculate CIP Makeup Water
Cleaning-in-place systems often circulate cleaning solutions through equipment and piping. The circulating flow is not the same as the fresh water required to fill, replenish and rinse the system.
Calculate daily CIP makeup from the fresh water used for solution preparation, rinsing, replenishment, and other cleaning steps that draw from the plant supply.
Daily CIP Makeup = Sum of Fresh Water Added During All Daily Cleaning Cycles
For example, assume CIP activities require 1,200 L/day of fresh makeup water. Count that volume once, regardless of how many times the cleaning solution circulates.
If the system reuses recovered rinse water, account for the reuse at its actual point of use. Do not subtract the same volume again when fresh makeup already reflects that saving.
Include Backwashing and Utility Makeup
Pretreatment filters may require periodic backwashing, while other equipment consumes water through flushing, regeneration, or maintenance operations. Calculate these requirements from the actual cycle volume and frequency.
Supporting utilities may also require fresh makeup water. Examples include cooling-system makeup and other equipment services, where applicable to the plant configuration.
For the continuing illustrative example, assume the following additional daily requirements:
- CIP makeup: 1,200 L/day.
- Utility makeup: 600 L/day.
- Pretreatment backwash: 800 L/day, supplied directly from raw water.
These figures are illustrative assumptions, not universal consumption rates. Backwash will be included separately in the source-water balance because it is supplied upstream of the RO system.
The next calculation step is to account for treatment recovery and reject water without counting those streams twice.
Calculate RO Recovery and Treatment Rejects
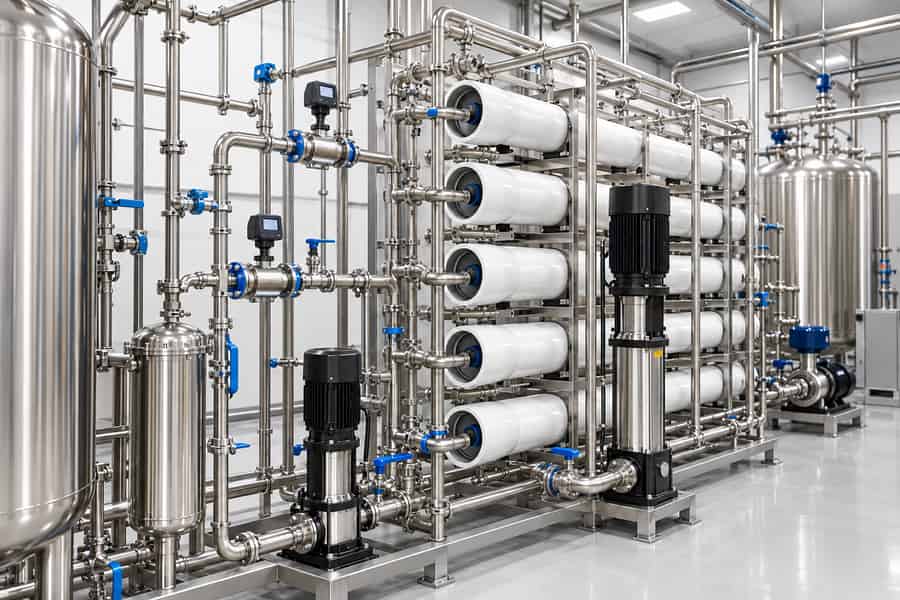
Reverse osmosis (RO) recovery determines how much feed water is required to produce the permeate used by the bottling plant. The remaining feed water leaves the RO process as concentrate.
For the illustrative example, the daily RO permeate requirement includes four uses:
- Filling: 10,302 L/day.
- Bottle rinsing: 3,060 L/day.
- CIP fresh makeup: 1,200 L/day.
- Utility makeup: 600 L/day.
The total RO permeate demand is:
10,302 + 3,060 + 1,200 + 600 = 15,162 L/day
Assume an illustrative RO recovery of 75%. For this calculation, recovery is the ratio of permeate produced to RO feed water supplied.
RO Feed Water = Required Permeate ÷ Recovery
Therefore, 15,162 ÷ 0.75 = 20,216 L/day.
The concentrate volume is the difference between RO feed and permeate production:
20,216 − 15,162 = 5,054 L/day.
This concentrate is already accounted for within the 20,216 L/day RO feed requirement. Adding it again to the feed-water demand would double-count the same water.
Actual recovery depends on source-water characteristics, pretreatment, membrane configuration, and operating conditions. The illustrative 75% value is not a universal design target or a verified specification for Brenu equipment.
Assemble the Complete Daily Source-Water Balance
The RO feed calculation does not yet include the separately supplied pretreatment backwash. Because the illustrative plant draws this backwash directly from raw water, add it to the RO feed requirement.
Assume pretreatment backwashing consumes 800 L/day. No other treatment losses or water-reuse credits are included in this example.
| Water-balance item | Daily volume | Calculation or treatment |
| Water delivered into bottles | 10,302 L | Product, overfill, and filled rejects |
| Bottle-rinsing demand | 3,060 L | Supplied by RO permeate |
| CIP fresh makeup | 1,200 L | Supplied by RO permeate |
| Utility fresh makeup | 600 L | Supplied by RO permeate |
| Total RO permeate demand | 15,162 L | Sum of the four uses above |
| RO feed water | 20,216 L | 15,162 ÷ 75% |
| RO concentrate | 5,054 L | 20,216 − 15,162; already included in feed |
| Pretreatment backwash | 800 L | Separate raw-water use |
| Total raw-water intake | 21,016 L | 20,216 + 800 |
All figures are illustrative assumptions, not Brenu specifications or guaranteed operating results. Subtotals and internal streams are shown for reconciliation; do not sum every row.
The source-water requirement is therefore 21,016 L/day, or 21.016 m³/day, under the stated assumptions. This total includes RO feed and separately supplied pretreatment backwash, without adding concentrate again.
The concentrate and backwash are discharge streams in this example. If recovered for an approved use, identify their destinations and count only the verified reduction in fresh-water demand.
Actual plants must add measured demands omitted here, such as additional pretreatment flushing, filter regeneration, pipe flushing, leaks, sanitation and other cleaning operations.
Check each addition against the treatment boundary to avoid counting existing losses twice. Include staff and other site services if the calculation covers total site intake rather than production alone.
Convert Daily Demand into Operating-Hour Capacity
Daily volume establishes how much water the plant needs over a production day. It does not establish the instantaneous flow rate required from treatment equipment, pumps, or distribution piping.
Treatment capacity depends on operating hours and when purified water is consumed. A plant treating water throughout the day may need a lower hourly rate than one treating only during production.
Use the following formula:
Required Average Permeate Production Rate = Daily Permeate Demand ÷ Available Treatment Operating Hours
For the illustrative demand of 15.162 m³/day:
| Available treatment time | Required average permeate production |
| 8 hours/day | 1.895 m³/h |
| 12 hours/day | 1.264 m³/h |
| 16 hours/day | 0.948 m³/h |
| 20 hours/day | 0.758 m³/h |
These are mathematical comparisons using the same illustrative daily demand. They do not represent equipment ratings or account for additional operating constraints.
The corresponding average RO feed rates are 2.527 m³/h over eight hours, 1.685 m³/h over twelve hours, and 1.264 m³/h over sixteen hours.
These figures use the illustrative 20.216 m³/day RO feed requirement. Available operating hours must reflect cleaning, maintenance, source availability and any periods when usable water production cannot occur.
Distinguish Treatment Capacity from Simultaneous Peak Flow
A treatment system can produce enough water over the day and still fail to supply the plant during its busiest period. Instantaneous demand may exceed treatment output or distribution capacity.
Three separate rates should be checked:
- Treatment production rate: The rate at which the treatment system produces usable water during operation.
- Distribution peak flow: The combined flow required by branches operating simultaneously, including filling, rinsing, and other active uses.
- Source-water supply rate: The flow required at raw-water intake to support treatment and any simultaneous raw-water uses.
Assume the illustrative bottling line operates for eight hours per day. Average water delivered into bottles is 10,302 ÷ 8 = 1,287.75 L/h, or approximately 1.288 m³/h.
Average rinsing demand is 3,060 ÷ 8 = 382.5 L/h. Their combined average is 1,670.25 L/h, approximately 1.670 m³/h, before any other overlapping withdrawals.
These averages support initial planning but are not instantaneous peak-flow values. Actual peak flow depends on equipment cycles, line speed, valve operation and overlapping cleaning or utility demands.
To size pumps and piping, establish the flow required by each branch and identify which branches can operate simultaneously.
Calculate Usable Storage and Tank Buffer Requirements
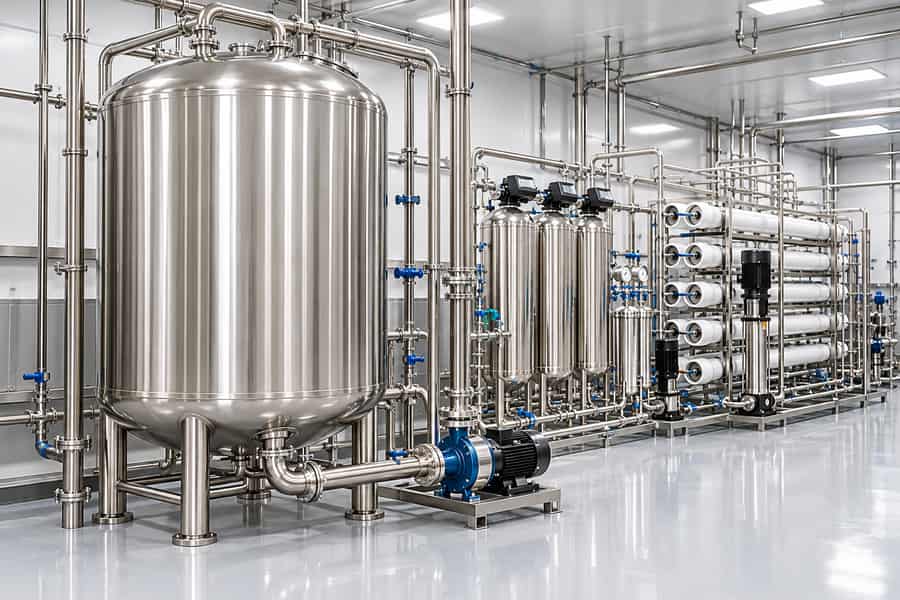
Storage bridges short periods when water demand exceeds treatment production. The required buffer depends on the timing of inflows and outflows, not simply the plant’s total daily consumption.
For a purified-water tank, calculate the change in inventory throughout the operating cycle:
Ending Inventory = Starting Inventory + Cumulative Inflow − Cumulative Outflow
Use actual treatment production and consumption schedules to identify the largest cumulative deficit between replenishment periods. Provide enough usable water to cover that deficit above the minimum operating level.
A filling line may consume purified water faster than treatment produces it during peak operation. The tank supplies the difference, then recovers its inventory when treatment production exceeds demand.
Consider these factors when determining usable storage:
- Starting inventory: The water available at the beginning of the operating period.
- Minimum operating level: Water that cannot be withdrawn while maintaining required operating conditions.
- Peak-period deficit: The maximum cumulative difference between water withdrawn and water replenished.
- Recovery period: The time available to restore inventory before the next high-demand period.
- Raw-water buffer: The reserve needed to manage supply interruptions or variations in incoming water availability, calculated separately from treated-water storage.
Nominal tank capacity is not necessarily usable capacity. Account for minimum and maximum operating levels, tank geometry, and any volume reserved for operational requirements without counting the same reserve twice.
Check both shortages and overflow throughout the schedule. Tank cleanability, drainage, vent protection and validated holding conditions also constrain acceptable storage; a larger volume is not automatically better.
Storage cannot solve a sustained daily deficit. If treatment produces less usable water than the plant consumes over a complete operating cycle, increasing tank size only delays the shortage.
The underlying treatment capacity or operating schedule must be corrected. Recovery between production peaks is part of tank sizing, not a separate assumption that can remain untested.
Practical Design-Input Checklist
Before selecting water-treatment equipment, pumps, and storage tanks, collect the following information. These inputs help translate a daily water balance into a workable plant design.
Brenu’s configurable water bottling line solutions can be evaluated against the plant’s source-water quality, production target and process requirements. Confirm the actual equipment scope and guaranteed operating conditions in the proposal.
- Production target: Good bottles required per day, bottle sizes, nominal fill volumes, operating hours, and expected filled-reject quantities.
- Filling performance: Actual average fill volume, overfill measurements, startup and spill losses, and whether any rejected product has an approved recovery route.
- Container handling: Single-use PET or returnable containers, rinsing method, water consumption per cycle, and washing requirements.
- Cleaning schedule: CIP cycles per day, fresh makeup per cycle, backwashing frequency, and other cleaning activities.
- Source-water characteristics: Available supply volume, water quality, supply pressure, and known seasonal variations.
- Treatment requirements: Finished-water quality targets, selected treatment stages, verified recovery assumptions, and measured discharge volumes.
- Simultaneous demand: Branch flow requirements during filling, rinsing, cleaning, and utility operation.
- Storage conditions: Available tank space, operating levels, required buffer, validated holding conditions, and time available for inventory recovery.
- Reuse arrangements: Recovered-water sources, approved destinations, actual reuse volumes, and any treatment needed before reuse.
- Operating constraints: Production shifts, treatment downtime, maintenance periods, and expected interruptions to the source supply.