
A monoblock filler should record timestamped operating states, stop and restart events, bottle counts, reject counts, speed, active format, and the reasons for lost production. Link these records with relevant alarms and utility conditions. The objective is to reconstruct what happened during a loss, not merely display a daily efficiency percentage.
Specify the data before the controls are finalized. Decide who will use it, which questions they must answer, and how long records must remain available. A machine can expose many signals while still failing to provide a usable account of its downtime.
Which Questions Should the Records Answer?
Begin with a few practical questions: when did accepted output stop, what prevented production, how long did recovery take, and how much output was lost? Then ask whether the same event repeats by bottle format, product, shift, or operating speed. These questions determine the fields required in the record.
Separate analysis of the filler from analysis of the complete line. A filler may stop because it lacks bottles, because its own capper has a fault, or because the downstream conveyor is blocked. Counting all three as filler breakdowns would direct improvement work toward the wrong equipment.
When specifying a monoblock filling system, include a data schedule alongside the mechanical and utility schedules. Name the required signal, unit, collection method, and retention period. Confirm what the supplier provides locally and what requires a plant reporting system.
What Operating States Must Be Distinguished?
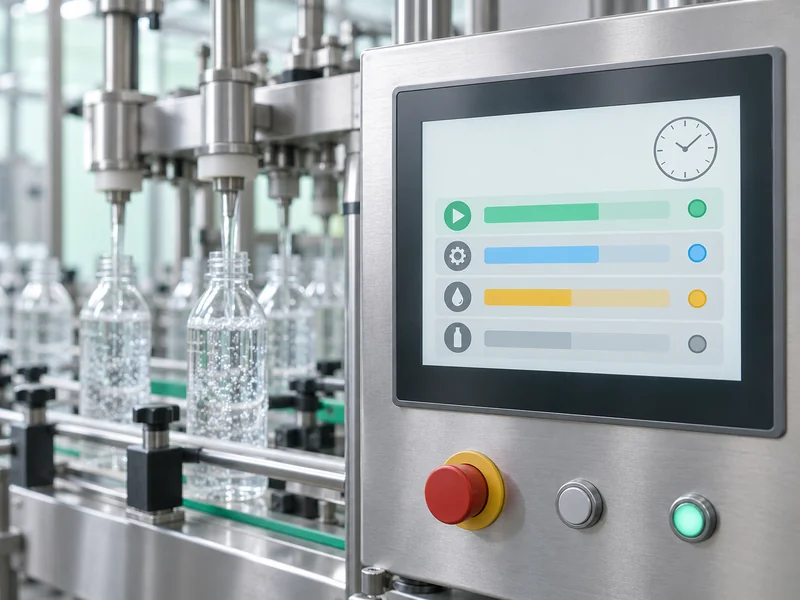
Use a defined state model with clear entry and exit rules. At minimum, distinguish production, stopped, changeover, cleaning, and conditions where production is not scheduled. Add starved and blocked states where upstream and downstream interfaces support reliable classification.
A running motor is not always equivalent to productive operation. The machine may rotate during setup or circulate cleaning liquid without processing saleable bottles. State logic must reflect the production purpose rather than a single drive signal.
Agree how overlapping conditions are handled. If a downstream blockage is followed by a local alarm, retain both events while assigning the stop duration according to a documented priority or causal rule. Otherwise, several alarms can each appear to claim the same lost minutes.
| Record Group | Typical Fields | Analysis Purpose |
| State transitions | Previous state, new state, event time | Reconstruct operating intervals |
| Stops | Start, end, reason, source equipment | Rank losses by duration and frequency |
| Production | Total count, good count, rejects, speed | Separate output and quality losses |
| Context | Product, bottle, cap, recipe revision | Compare equivalent operating conditions |
| Recovery | Restart time, stable output time, restart waste | Measure the complete recovery burden |
How Should Stop Events Be Timestamped?
Record the event time at the appropriate control source and preserve it when data moves to another system. Distinguish that timestamp from the time a server received the message. A network delay should not appear to change the order of machine events.
Specify clock synchronization, time-zone handling, and the behavior after a power interruption. Where multiple machines contribute to one timeline, their clocks need an agreed relationship. Store enough information to interpret records across shift boundaries and local clock changes.
Define the shortest stop that will be recorded and the resolution required for its duration. Small interruptions can accumulate into a large loss even when operators never enter a reason. If brief stops are grouped, retain the count and total duration rather than silently discarding them.
How Do You Keep Reason Codes Useful?
Use a short hierarchy that separates equipment faults, material shortages, utility problems, planned activities, and external line conditions. Let operators select a practical reason when automatic signals cannot establish the cause. Avoid a long list of nearly identical codes that encourages arbitrary choices.
Keep the machine-generated trigger separate from the confirmed cause. A low bottle count may identify the symptom, while investigation later finds a damaged guide or an upstream supply interruption. Both pieces of information are useful if their relationship is preserved.
- Give every reason a stable identifier and a plain-language description.
- Retain an unclassified category so missing information remains visible.
- Record who changed a reason and when the change occurred.
- Allow a concise comment for unusual circumstances.
- Review frequently used miscellaneous codes and improve the taxonomy.
Do not force operators to classify an event before they can safely restore the process. The interface should support the plant’s operating procedure. A later review can complete the explanation without rewriting the original event time.
Which Bottle Counts Are Necessary?
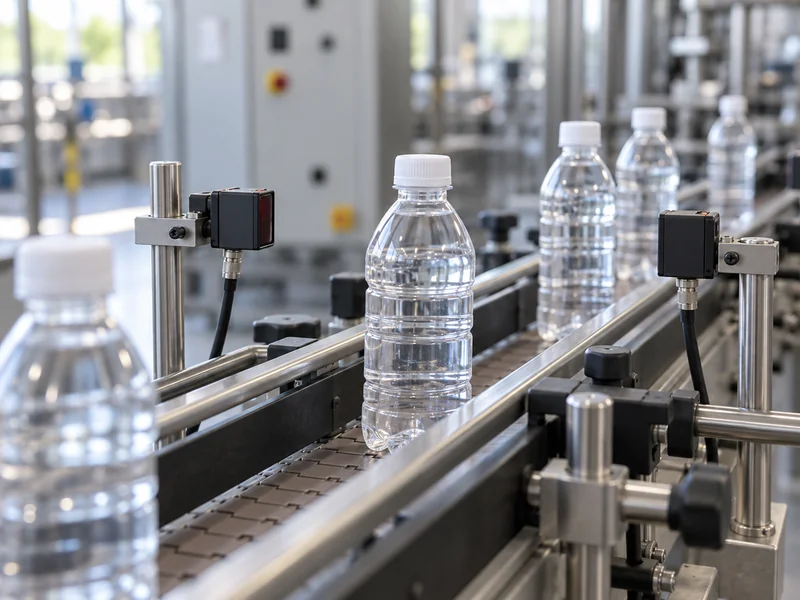
Define where each count is measured: infeed, filled output, capped output, reject discharge, or accepted line output. Counts from different physical points cannot be subtracted casually when bottles remain between them. Identify work in progress and the handling of manual removal.
Keep total processed bottles, accepted bottles, and rejects separate. Record reject categories where reliable inspection signals exist. Document whether a reworked bottle is counted again and how resets, batch changes, and counter rollover are handled.
Use the same definitions in the HMI, exported data, and acceptance test. A dashboard can look convincing while combining incompatible counters. Reconcile the recorded values against a controlled physical sample run before relying on them for production reporting.
How Should Speed and Recovery Be Recorded?
Store commanded speed and measured production rate as different values when both are available. Include the units and averaging interval. A momentary speed setting does not prove the machine delivered that output over an entire shift.
For restart analysis, mark the stop end and the point at which stable acceptable output resumes. The intervening ramp, inspection, and initial rejects can be operationally significant. An analysis ending at the first motor movement would miss that recovery cost.
Record selected utility and process values when they explain a known loss mechanism. Examples may include air pressure, product availability, cap supply, or relevant temperature states. Choose signals with an engineering purpose instead of collecting every value at the highest possible frequency.
What Is Needed for a Meaningful OEE Calculation?
Agree the accounting rules before displaying an OEE result. Define the scheduled production interval, the time actually spent running, the approved rate for the format, and the disposition of counted bottles. Preserve the separate measures of availability, performance, and quality so the plant can explain which kind of loss changed the result.
Use the ideal cycle time appropriate to the approved format and operating specification. Keep its revision history so a changed reference rate does not make historical improvement appear larger or smaller. Document how cleaning, changeover, breaks, and unscheduled production are classified.
Report the underlying quantities with the calculated result. A single percentage cannot tell whether a problem comes from long stops, slow operation, or rejected bottles. The supporting records make the result auditable and useful for action.
How Should Data Be Exported and Preserved?
Agree an accessible export or integration method with the plant’s controls team. Specify field names, units, identifiers, and the behavior when communication is lost. Local buffering should preserve the required records until the connection returns, within the agreed storage capacity.
Include retention, backup, permissions, and restoration in the handover. Restrict changes to classifications and reference rates to authorized roles while allowing the people responsible for improvement to read the data. Document gaps explicitly rather than replacing missing intervals with assumed production.
How Should the Team Use the First Month of Records?
Review the largest losses with operators and maintenance staff while the events are still familiar. Compare rankings by total duration and by frequency: one extended repair and many brief cap-feed interruptions require different responses. Inspect the underlying event sequences before assigning a corrective action.
Check whether a loss is concentrated on one package or appears across the full production mix. Compare equivalent scheduled intervals and account for format-specific rates. This prevents a busy shift with more changeovers from looking mechanically less reliable simply because its production plan was different.
Assign each improvement an owner and a measurable outcome, such as fewer repeat stops or less restart waste. After implementing it, compare the same fields over a suitable period. The data system earns its value when it helps verify a change on the line.
What Should Be Tested Before Acceptance?
Create a short sequence of known events: normal production, bottle shortage, downstream blocking, an approved local fault challenge, restart, and a format change. Compare the exported timeline with the observed sequence. Check timestamps, durations, counts, classifications, and any operator corrections.
Include a controlled communication interruption and verify recovery without duplicate or missing records. Check a shift or batch boundary and confirm that an ongoing stop is represented correctly. Preserve the test file as an example for the plant reporting team.
To define the required reporting scope, discuss your downtime-analysis needs with Brenu. Request sample records and an acceptance demonstration so the delivered system supports the decisions your production team actually needs to make.