
To calculate ROI for a water bottling line, start with the total project investment, estimate realistic annual output, calculate selling price and cost per bottle, subtract fixed operating expenses, and compare annual net profit with the initial investment.
A good ROI calculation should not only answer “How much does the machine cost?” It should also answer “How many bottles can we sell profitably every year?” When capacity, automation, bottle cost, packaging format, and sales channels are planned together, a water bottling line can become a stable and scalable investment.
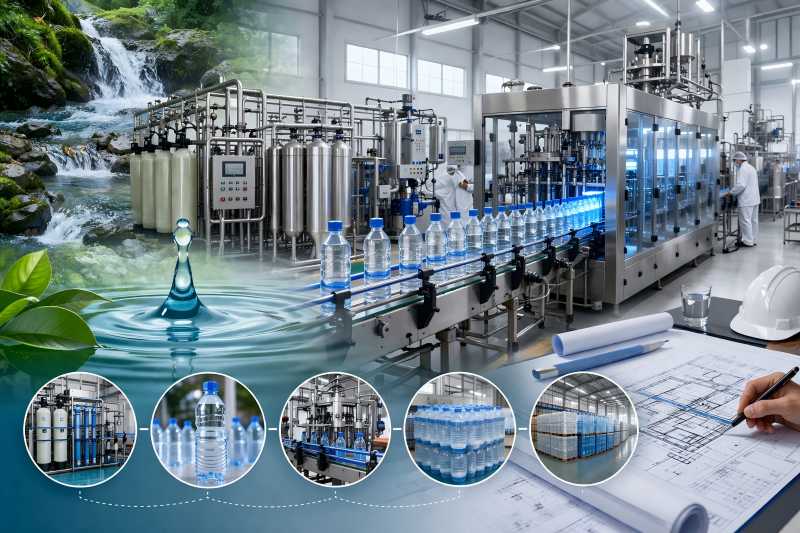
What Does ROI Mean for a Water Bottling Line?
ROI measures the profit generated from a bottling project against its total investment. For a water bottling plant, ROI is affected by machine cost, production speed, bottle size, material cost, labor, energy use, selling price, and actual sales volume.
The basic formula is:
ROI = Annual Net Profit ÷ Total Project Investment × 100%
Another useful formula is:
Payback Period = Total Project Investment ÷ Annual Net Cash Profit
For example, if a water bottling line costs USD 500,000 and generates USD 250,000 net profit per year, the payback period is about 2 years. The ROI is 50% per year.
Step 1: Calculate the Total Initial Investment
Assess total project cost before focusing on machine price. A water bottling line usually includes water treatment, bottle blowing, air compressor, filling and capping machine, labeling machine, shrink wrapping or carton packing system, conveyors, inspection units, and installation.
Small automatic bottling systems may run around 2,000–5,000 bottles per hour depending on bottle size and configuration, while large high-speed lines can reach much higher capacities, even up to 72,000 bottles per hour in advanced systems.
| Investment Item | Typical Function | Estimated Cost Range |
| Water treatment system | Filtration, RO, UV, ozone, storage | USD 20,000–150,000 |
| Bottle blowing system | Produces PET bottles from preforms | USD 30,000–150,000 |
| Rinsing filling capping machine | Main bottling equipment | USD 80,000–300,000+ |
| Labeling and coding system | Applies labels and prints date/batch code | USD 15,000–80,000 |
| Packing system | Shrink wrapping, carton packing, palletizing | USD 30,000–200,000 |
| Utilities and installation | Compressor, piping, conveyors, setup | USD 30,000–150,000 |
| Working capital | Materials, inventory, labor reserve | USD 50,000–200,000 |
Some manufacturer cost guides list blow molding machines at about USD 30,000–150,000 and automated fillers at about USD 25,000–200,000, but actual costs depend heavily on speed, automation level, bottle size, brand, and customization.
Step 2: Estimate Real Production Output
Many buyers calculate ROI based only on rated machine speed, but this often creates an unrealistic result. A 6,000 BPH line does not produce at full speed every minute of the day.
You need to consider operating hours, working days, and production efficiency. This efficiency is often affected by bottle changeover, cleaning, label adjustment, cap supply, operator skill, raw material quality, and machine maintenance.
A practical formula is:
Annual Output = Rated Speed × Daily Working Hours × Working Days × Operating Efficiency
For example:
6,000 bottles/hour × 8 hours/day × 300 days × 85% efficiency = 12,240,000 bottles per year
This number is more useful than the rated capacity because it reflects real factory operation.
Step 3: Calculate Revenue from Bottled Water Sales
Sales volume and bottle price determine revenue. The selling price will be different for wholesale distribution, supermarket retail, private label water, hotel supply, office delivery, and premium mineral water.
A basic revenue formula is:
Annual Revenue = Annual Bottles Sold × Average Selling Price
If a plant sells 12,240,000 bottles per year at USD 0.16 per bottle, the annual revenue is:
12,240,000 × USD 0.16 = USD 1,958,400
This does not mean all revenue becomes profit. The next step is to subtract production and operating costs.
Step 4: Estimate Cost Per Bottle
Cost per bottle is one of the most important numbers in ROI calculation. Even a small difference of USD 0.005 per bottle can become a large amount when annual production reaches millions of bottles.
Main cost items include PET preforms or empty bottles, caps, labels, shrink film, cartons, water treatment chemicals, electricity, labor, machine maintenance, warehouse handling, and logistics.
| Cost Item | Example Cost Per 500ml Bottle | Notes |
| PET preform/bottle | USD 0.035 | Depends on gram weight and PET price |
| Cap | USD 0.008 | Standard plastic screw cap |
| Label | USD 0.006 | OPP, PVC, shrink sleeve, or paper label |
| Shrink film/carton | USD 0.012 | Changes by packing format |
| Water treatment and utilities | USD 0.004 | Water, power, ozone, UV, filters |
| Labor | USD 0.010 | Based on automation level |
| Maintenance and spare parts | USD 0.005 | Includes wear parts and service |
| Logistics and handling | USD 0.015 | Local delivery or distributor supply |
| Total Variable Cost | USD 0.095 | Example only |
If the selling price is USD 0.16 and the variable cost is USD 0.095, the gross contribution per bottle is:
USD 0.16 – USD 0.095 = USD 0.065 per bottle
This gross contribution helps cover fixed costs and recover the equipment investment.
Step 5: Add Fixed Operating Costs
Fixed costs do not change directly with every bottle produced. These may include factory rent, management salaries, quality testing, licenses, marketing, insurance, loan interest, depreciation, and routine administration.
For a medium-sized bottling operation, annual fixed costs may include:
- Factory rent and facility cost
- Quality control and water testing
- Sales and marketing expenses
- Management and office staff
- Equipment depreciation
- Finance cost or loan interest
- Certification and compliance expenses
For example, if annual fixed costs are USD 250,000, they must be deducted from gross contribution before calculating net profit.
Step 6: Calculate Annual Profit
Using the earlier example:
Annual output: 12,240,000 bottles
Selling price: USD 0.16 per bottle
Variable cost: USD 0.095 per bottle
Gross contribution: USD 0.065 per bottle
Annual gross contribution:
12,240,000 × USD 0.065 = USD 795,600
Then subtract annual fixed costs:
USD 795,600 – USD 250,000 = USD 545,600 estimated annual net operating profit
If the total project investment is USD 800,000, the ROI is:
USD 545,600 ÷ USD 800,000 × 100% = 68.2%
The payback period is:
USD 800,000 ÷ USD 545,600 = 1.47 years
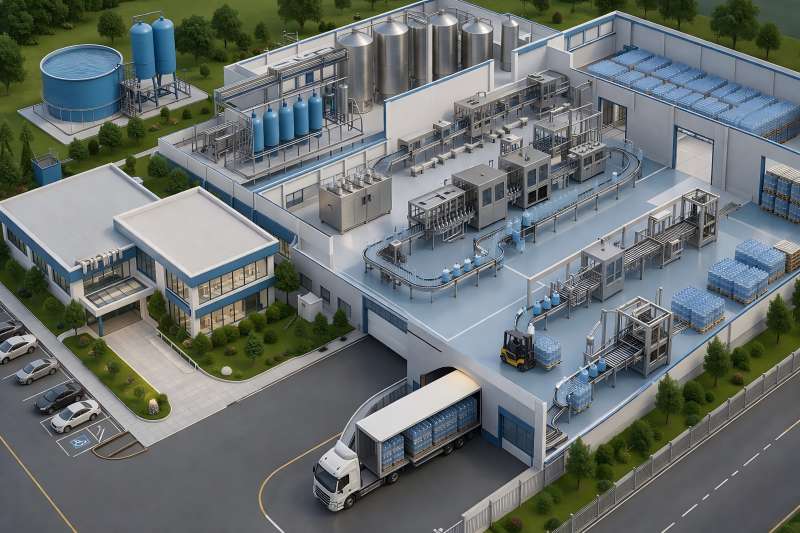
ROI Example for Different Water Bottling Line Capacities
The following table shows how capacity affects ROI. These figures are only a sample model and should be adjusted based on local material prices, labor cost, selling price, and distribution model.
| Line Capacity | Annual Output Assumption | Project Investment | Annual Net Profit | Estimated ROI | Payback Period |
| 3,000 BPH | 6.12 million bottles | USD 450,000 | USD 190,000 | 42.2% | 2.37 years |
| 6,000 BPH | 12.24 million bottles | USD 800,000 | USD 545,600 | 68.2% | 1.47 years |
| 12,000 BPH | 24.48 million bottles | USD 1,500,000 | USD 1,050,000 | 70.0% | 1.43 years |
Higher capacity does not automatically mean better ROI. A high-speed water bottling line only performs well when the company has enough sales channels, stable raw material supply, skilled operators, and strong distribution capacity.
Factors That Can Improve ROI
Choose the Right Capacity
A low-capacity line may restrict future growth. A line that is too large may create idle equipment, higher depreciation, and unnecessary loan pressure.
For a new bottled water brand, a medium-speed line may be safer than an oversized high-speed project. For an established distributor, a faster automatic line can reduce labor cost and improve unit economics.
Improve Bottle Lightweighting
PET bottle weight directly affects cost per bottle. If the bottle design can be optimized from 12g to 10g without affecting strength, the saving becomes significant across millions of bottles.
However, lightweighting must be balanced with bottle stability, filling performance, labeling quality, and transport strength.
Increase Automation
Automatic bottle feeding, cap sorting, labeling, shrink wrapping, and palletizing can reduce labor dependence. It helps control labor pressure and maintain stable production quality.
Automation also reduces human contact with bottles, which supports better hygiene and more stable output.
Reduce Downtime
Downtime reduces the real output of the water bottling line. Common causes include label misalignment, cap jams, bottle deformation, unstable air pressure, poor-quality preforms, and slow changeover.
Regular maintenance, skilled operation, and timely spare parts supply help reduce downtime and speed up investment recovery.
Optimize Packaging Format
Packaging affects both cost and sales value. A 24-bottle shrink pack may be cost-effective for wholesale, while carton packing may work better for premium retail or export.
The best packaging format should match the sales channel, transport distance, shelf display, and customer price expectations.
Common ROI Mistakes to Avoid
Many buyers only compare machine prices and ignore the total cost of ownership. A cheaper line may require more operators, more maintenance, and longer downtime, which reduces profit over time.
Another common mistake is using rated speed as actual output. Real production should include efficiency loss, cleaning time, material replacement, and daily startup preparation.
Some investors also underestimate working capital. Even after the machine arrives, the business still needs bottles or preforms, caps, labels, cartons, warehouse space, delivery vehicles, and cash flow for distributors.
How Soon Can ROI Be Achieved?
For many water bottling projects, a reasonable payback period may range from 1.5 to 4 years. A strong local brand with good distribution may recover the investment faster, while a new brand in a competitive market may need more time.
The payback period depends more on sales stability than machine speed alone. A 12,000 BPH line with weak orders may perform worse than a 6,000 BPH line with stable daily demand.